What Can You Do With Page Signals?
Brief guide to the Page Signals Chrome extension: full content extraction, on-page SEO checks, link inventories, automated image audits, and live GSC data for any page.
There’s a portion of the work in SEO that’s a bit more ad-hoc in nature. On-the-fly, page-by-page checks that come up routinely, sometimes as part of a planned project, sometimes because you’ve landed on a URL and want a fast read on something specific. Maybe it’s the meta title and description, or a walk through the heading hierarchy. Maybe it’s the body links you’re after: what’s there, where they’re pointing, whether any are quietly resolving as 301s or 404s. Other times it’s the image set, or how the page is currently performing in organic search and which queries are driving the impressions.
Individually, these checks are trivial. The in-between steps are the annoying part. DevTools open in one tab for the head, another extension for the heading hierarchy, a separate tab for Search Console. By the time you’ve stitched the picture together, you’ve broken what you were doing three or four times over. None of it is a real bottleneck. It’s just enough friction that you end up doing the checks less often than you should.
I got tired of them. I wanted the core, table-stakes on-page signals accessible to me right in the browser, on the page I was already looking at, without reaching for any other tool or app, no matter how lightweight. That’s the entire premise behind Page Signals.
Page Signals is built for individual single-page checks, or small-batch ones at low scale (five or ten pages, not a thousand), where the goal is a fast, complete read of what’s there without context-switching into a heavier tool to get it. There are great crawlers for the heavier work. Screaming Frog, Sitebulb, OnCrawl. That’s still where I go when I need to crawl thousands of URLs and pull rich page-level SEO data at scale. Some folks roll custom JS bookmarklets for the individual-page version of this work, which can work for a slice of the use case. Page Signals is the consolidated version: everything in one popup, designed to cover the dozen-or-so individual-page workflows that come up routinely without making you queue a crawl or stitch output together from four places.
Click the icon and you get five tabs: full-page content extraction, on-page metadata and heading hierarchy, content-area link audit, content-area image audit, and live Search Console performance for the URL you’re viewing. Four of the five work instantly on any page. Only the Search Console tab needs a one-time OAuth connection.
The tipping point that pushed me to actually build this was the content-extraction piece specifically. I kept wanting to copy the full main content from a page, cleanly and reliably, in a structured format that preserved the formatting nuances an AI tool actually needs to reason about an existing page. That ended up being the part of the extension I get the most use out of.
Extract the actual content from any page
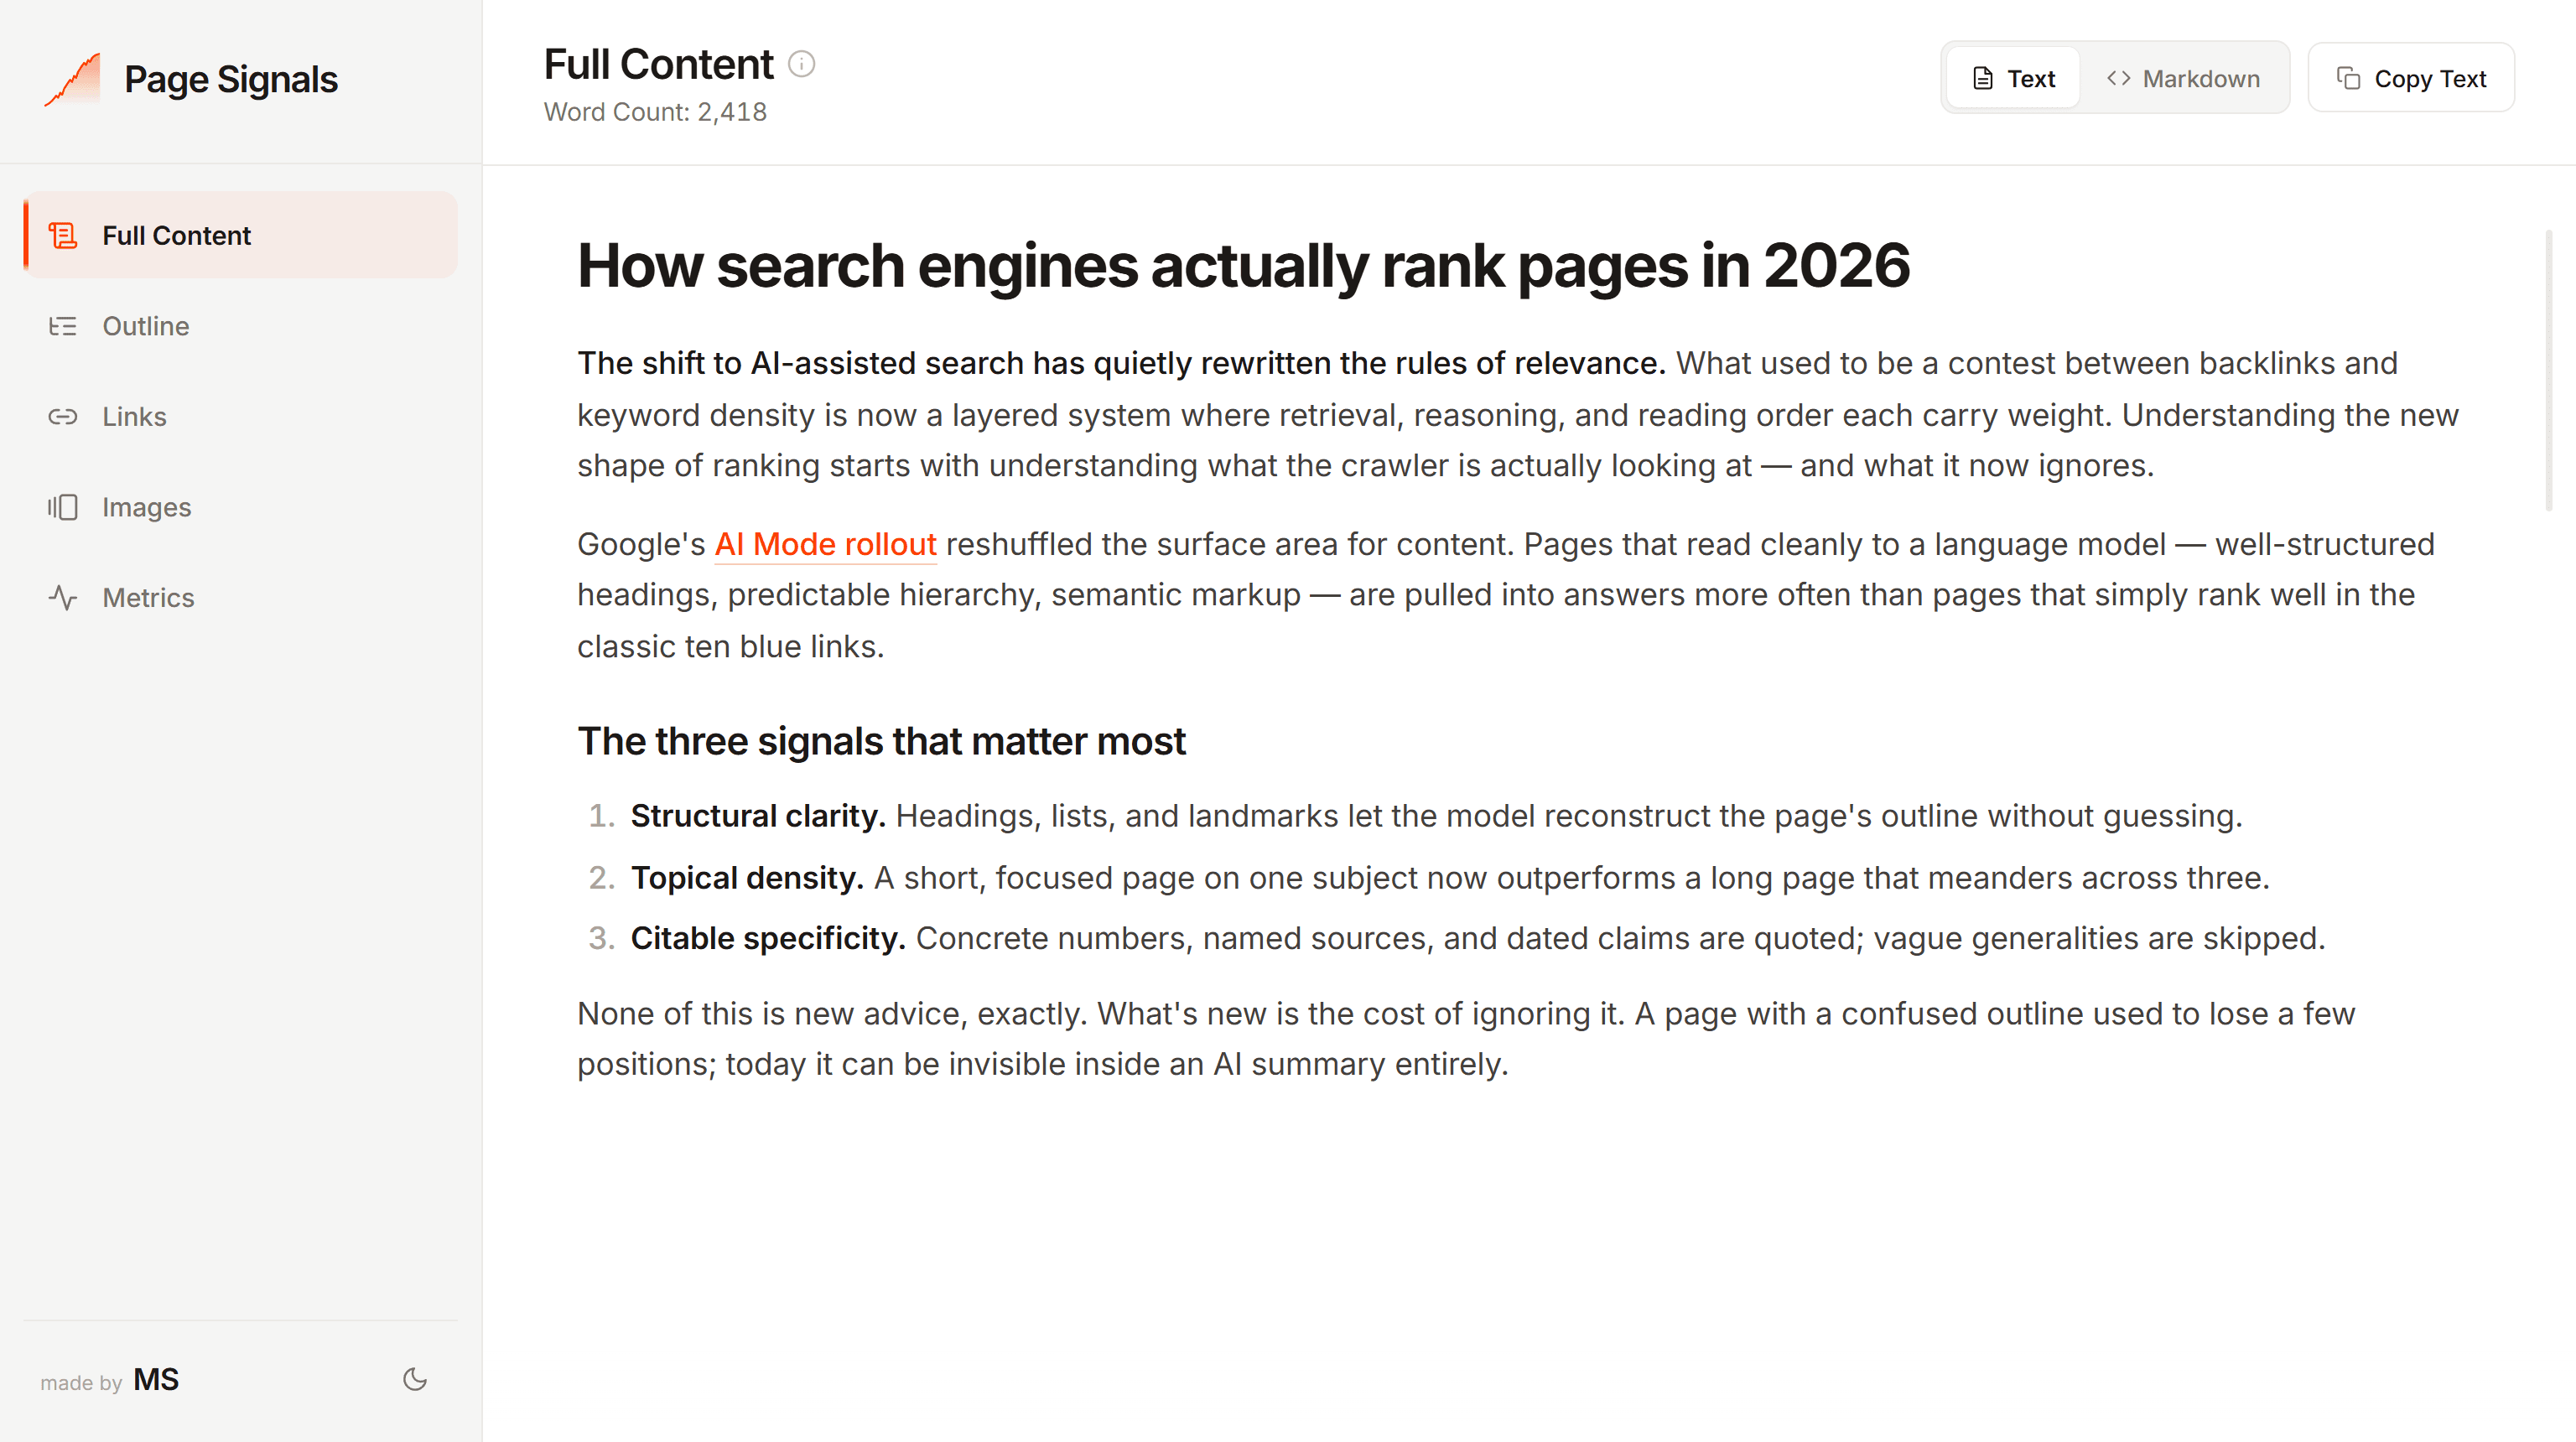
The Full Content tab pulls the main body content from whatever page you’re viewing — the article, the blog post, the page copy — and leaves everything else behind. One click to extract, one click to copy. You’re mid-workflow in an AI chat and need the full page? It’s on your clipboard in two seconds. The extraction filters out everything that isn’t the actual content — navigation, sidebars, footers, related post blocks, newsletter signup forms, share widgets, author bio boxes, cookie banners. All stripped out automatically.
If you’ve ever copy-pasted a blog post into ChatGPT or Claude, you know why this matters. You end up with nav links, “you may also like” sections, and footer content mixed into your prompt. The AI has to sort through all of that instead of focusing on the content you actually care about.
The extraction works across platforms — WordPress, Ghost, Medium, Substack, Webflow, custom-built sites — and it handles the edge cases that simpler extractors miss. Content that lives inside unusual containers, H1 tags placed in hero sections outside the main article element, images wrapped in <figure> tags with captions. The output is clean, structured content with headings, paragraphs, lists, links, images, blockquotes, code blocks, and tables all intact.
Text and Markdown views
A toggle at the top of the tab switches between two views.
Text view renders the content as formatted HTML. Copy it, and rich formatting pastes directly into Google Docs, Notion, or Word — headings, bold, links, everything preserved.
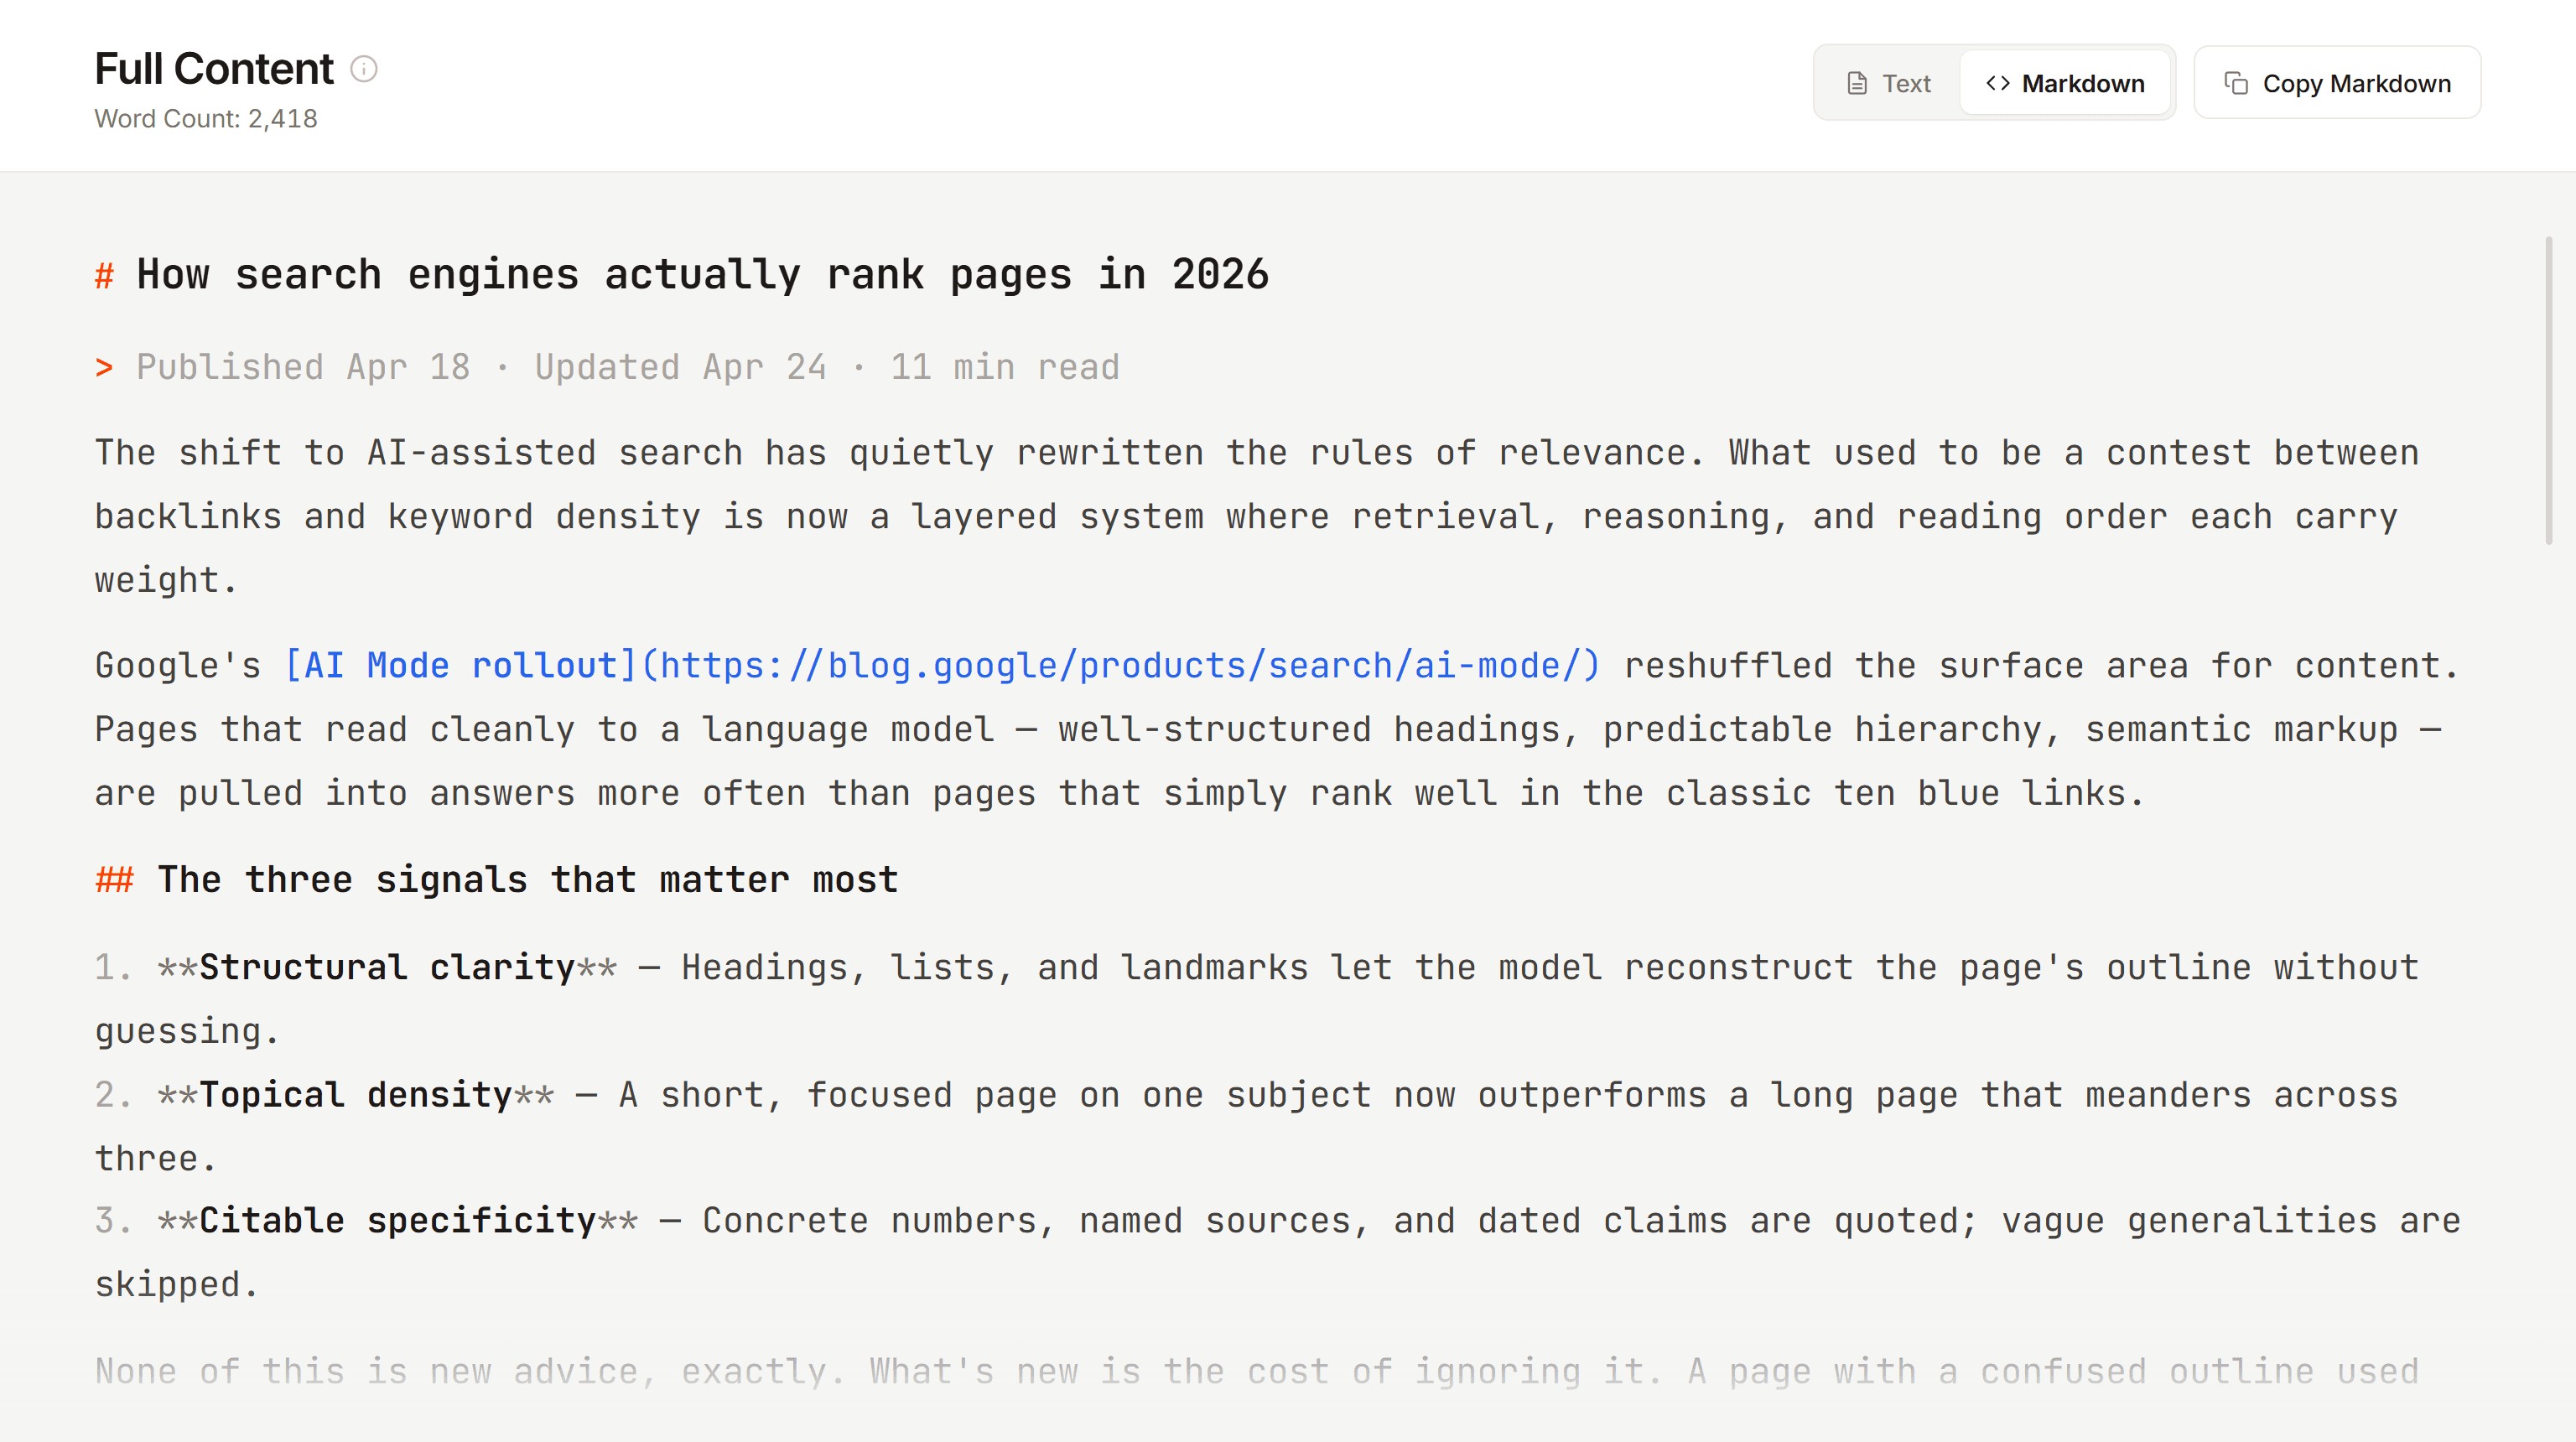
Markdown view shows the raw Markdown. Copy it, and the clipboard actually receives two formats simultaneously: Markdown as plain text and formatted HTML as rich text. Paste into an AI chat and it gets the Markdown. Paste into a rich editor and it renders beautifully. One copy action, both formats.
Why Markdown changes the AI conversation
The difference between pasting plain text and pasting Markdown into an AI tool is the difference between “here’s a wall of text, help me improve it” and “here’s a structured document with specific headings, sections, and hierarchy — give me targeted feedback.”
With Markdown, the AI sees your H2s and the sub-sections nested beneath them, your list structures, your internal links, your images and their placement, your blockquotes. It’s not just the words — it’s how the content is built. The analysis gets more specific: instead of vague suggestions to “reorganize your content,” you get feedback tied to actual sections and structural decisions.
Combine the Markdown export with the performance data from the Metrics tab — the keywords you’re ranking for, how traffic is trending — and you’re giving the AI the context it needs to make suggestions grounded in real data, not guesswork.
Try this → Copy the markdown and pair it with this Content Refresh Skill/Prompt
Run a quick SEO health check
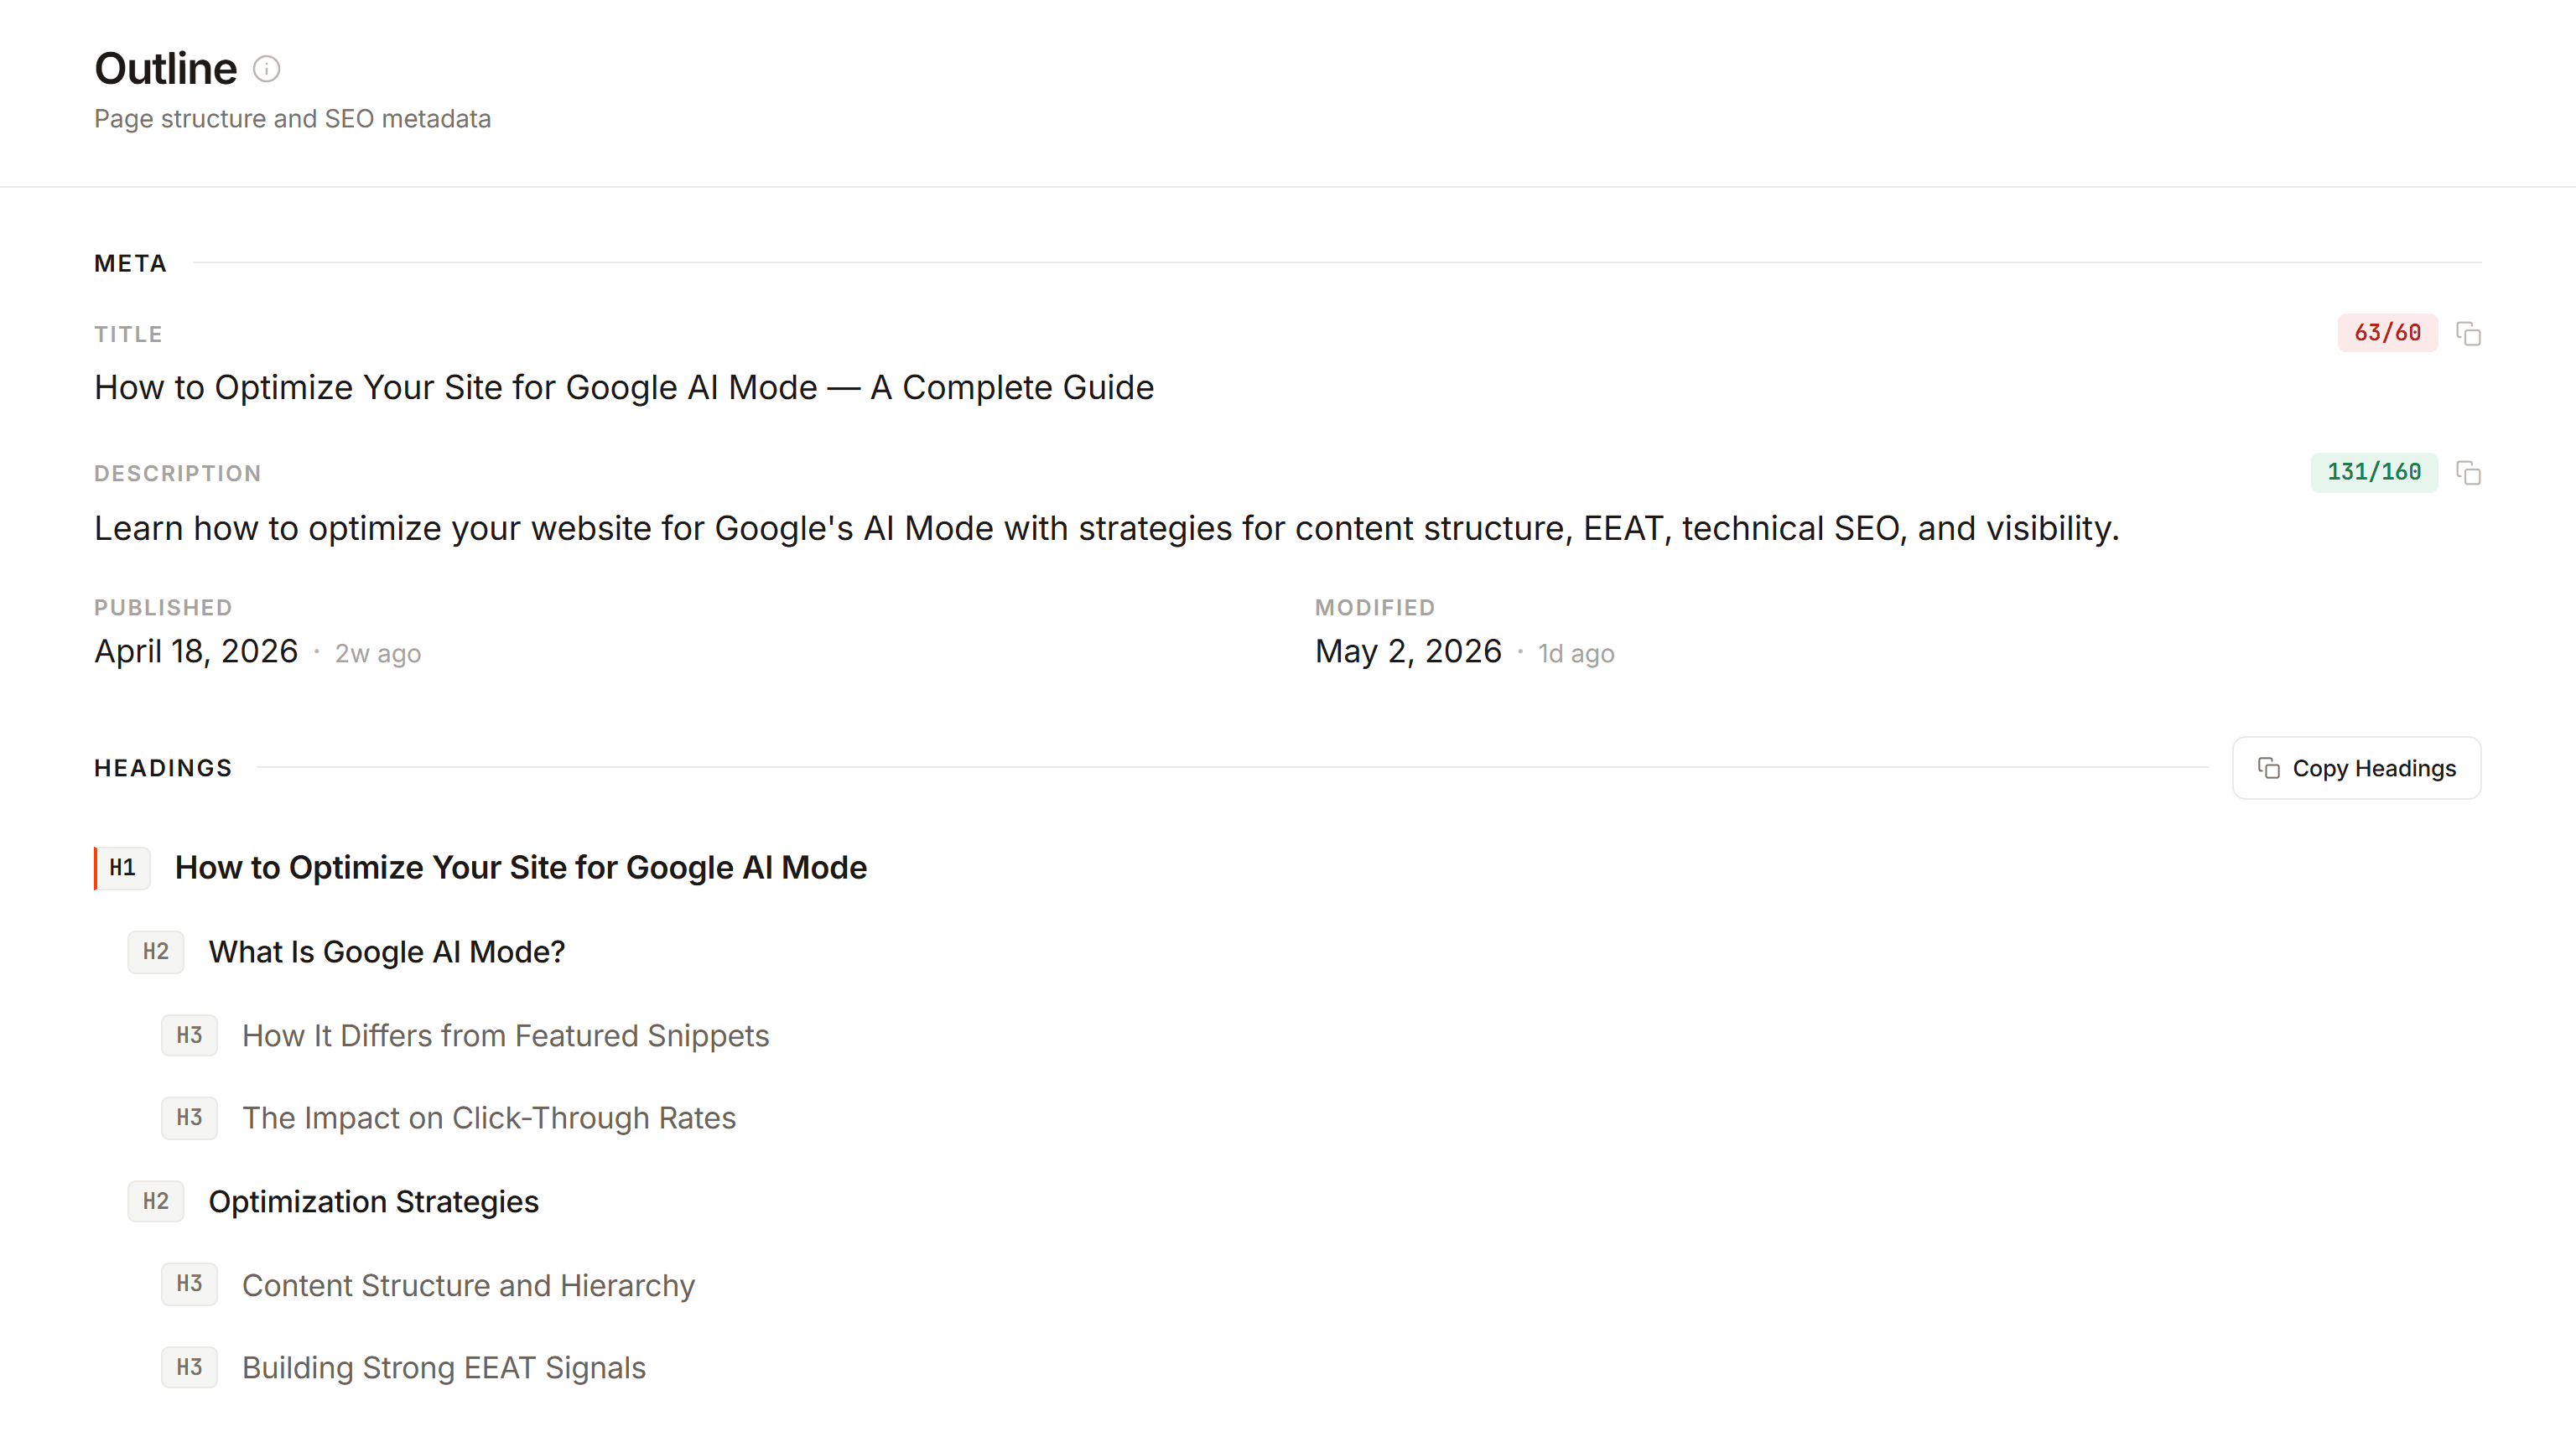
The Outline tab is the 2-minute sanity check. It surfaces the metadata and heading structure that would otherwise mean opening DevTools and digging through <head> tags.
META section
Five fields — Title, Description, Author, Published, and Modified — each pulled from the most reliable source the page offers.
Title prefers the clean version without the ”| Site Name” suffix that most CMS platforms append. Author cross-references structured data, meta tags, and DOM elements, because surprisingly few sites make the author easy to find programmatically. Published and Modified dates include relative freshness indicators — “2 months ago,” “8 days ago” — so you can gauge content age at a glance without doing the math on a raw timestamp.
Character count badges on the Title and Description fields are color-coded against Google’s SERP display thresholds — green if you’re safely within limits, amber at the boundary, red if it’s likely getting truncated. The format shows current/max (e.g., “52/60”), so you can see exactly how much room you have without reaching for a separate character counter. Both fields have copy buttons for quickly grabbing the current meta text — useful for optimization briefs or AI prompts.
HEADINGS section
Every content heading in document order, visually indented by level. H1 gets a distinctive orange left border. The same content filtering that powers the Full Content tab applies here — headings from related post blocks, table-of-contents widgets, and sidebars don’t appear. You’re looking at the actual content hierarchy, nothing else.
A “Copy Headings” button grabs the entire heading tree for pasting into content briefs, audit spreadsheets, or AI prompts focused on structure.
The quick-glance tab
You land on a page and want to know: Is the title optimized and within display limits? Is the description compelling or getting cut off? Is there exactly one H1? Does the heading hierarchy flow logically? When was this last updated?
All visible the moment you click the tab. For pre-publish checks, competitive scans, or content audits — this is probably the tab you’ll visit most often after Full Content.
Audit every link on the page
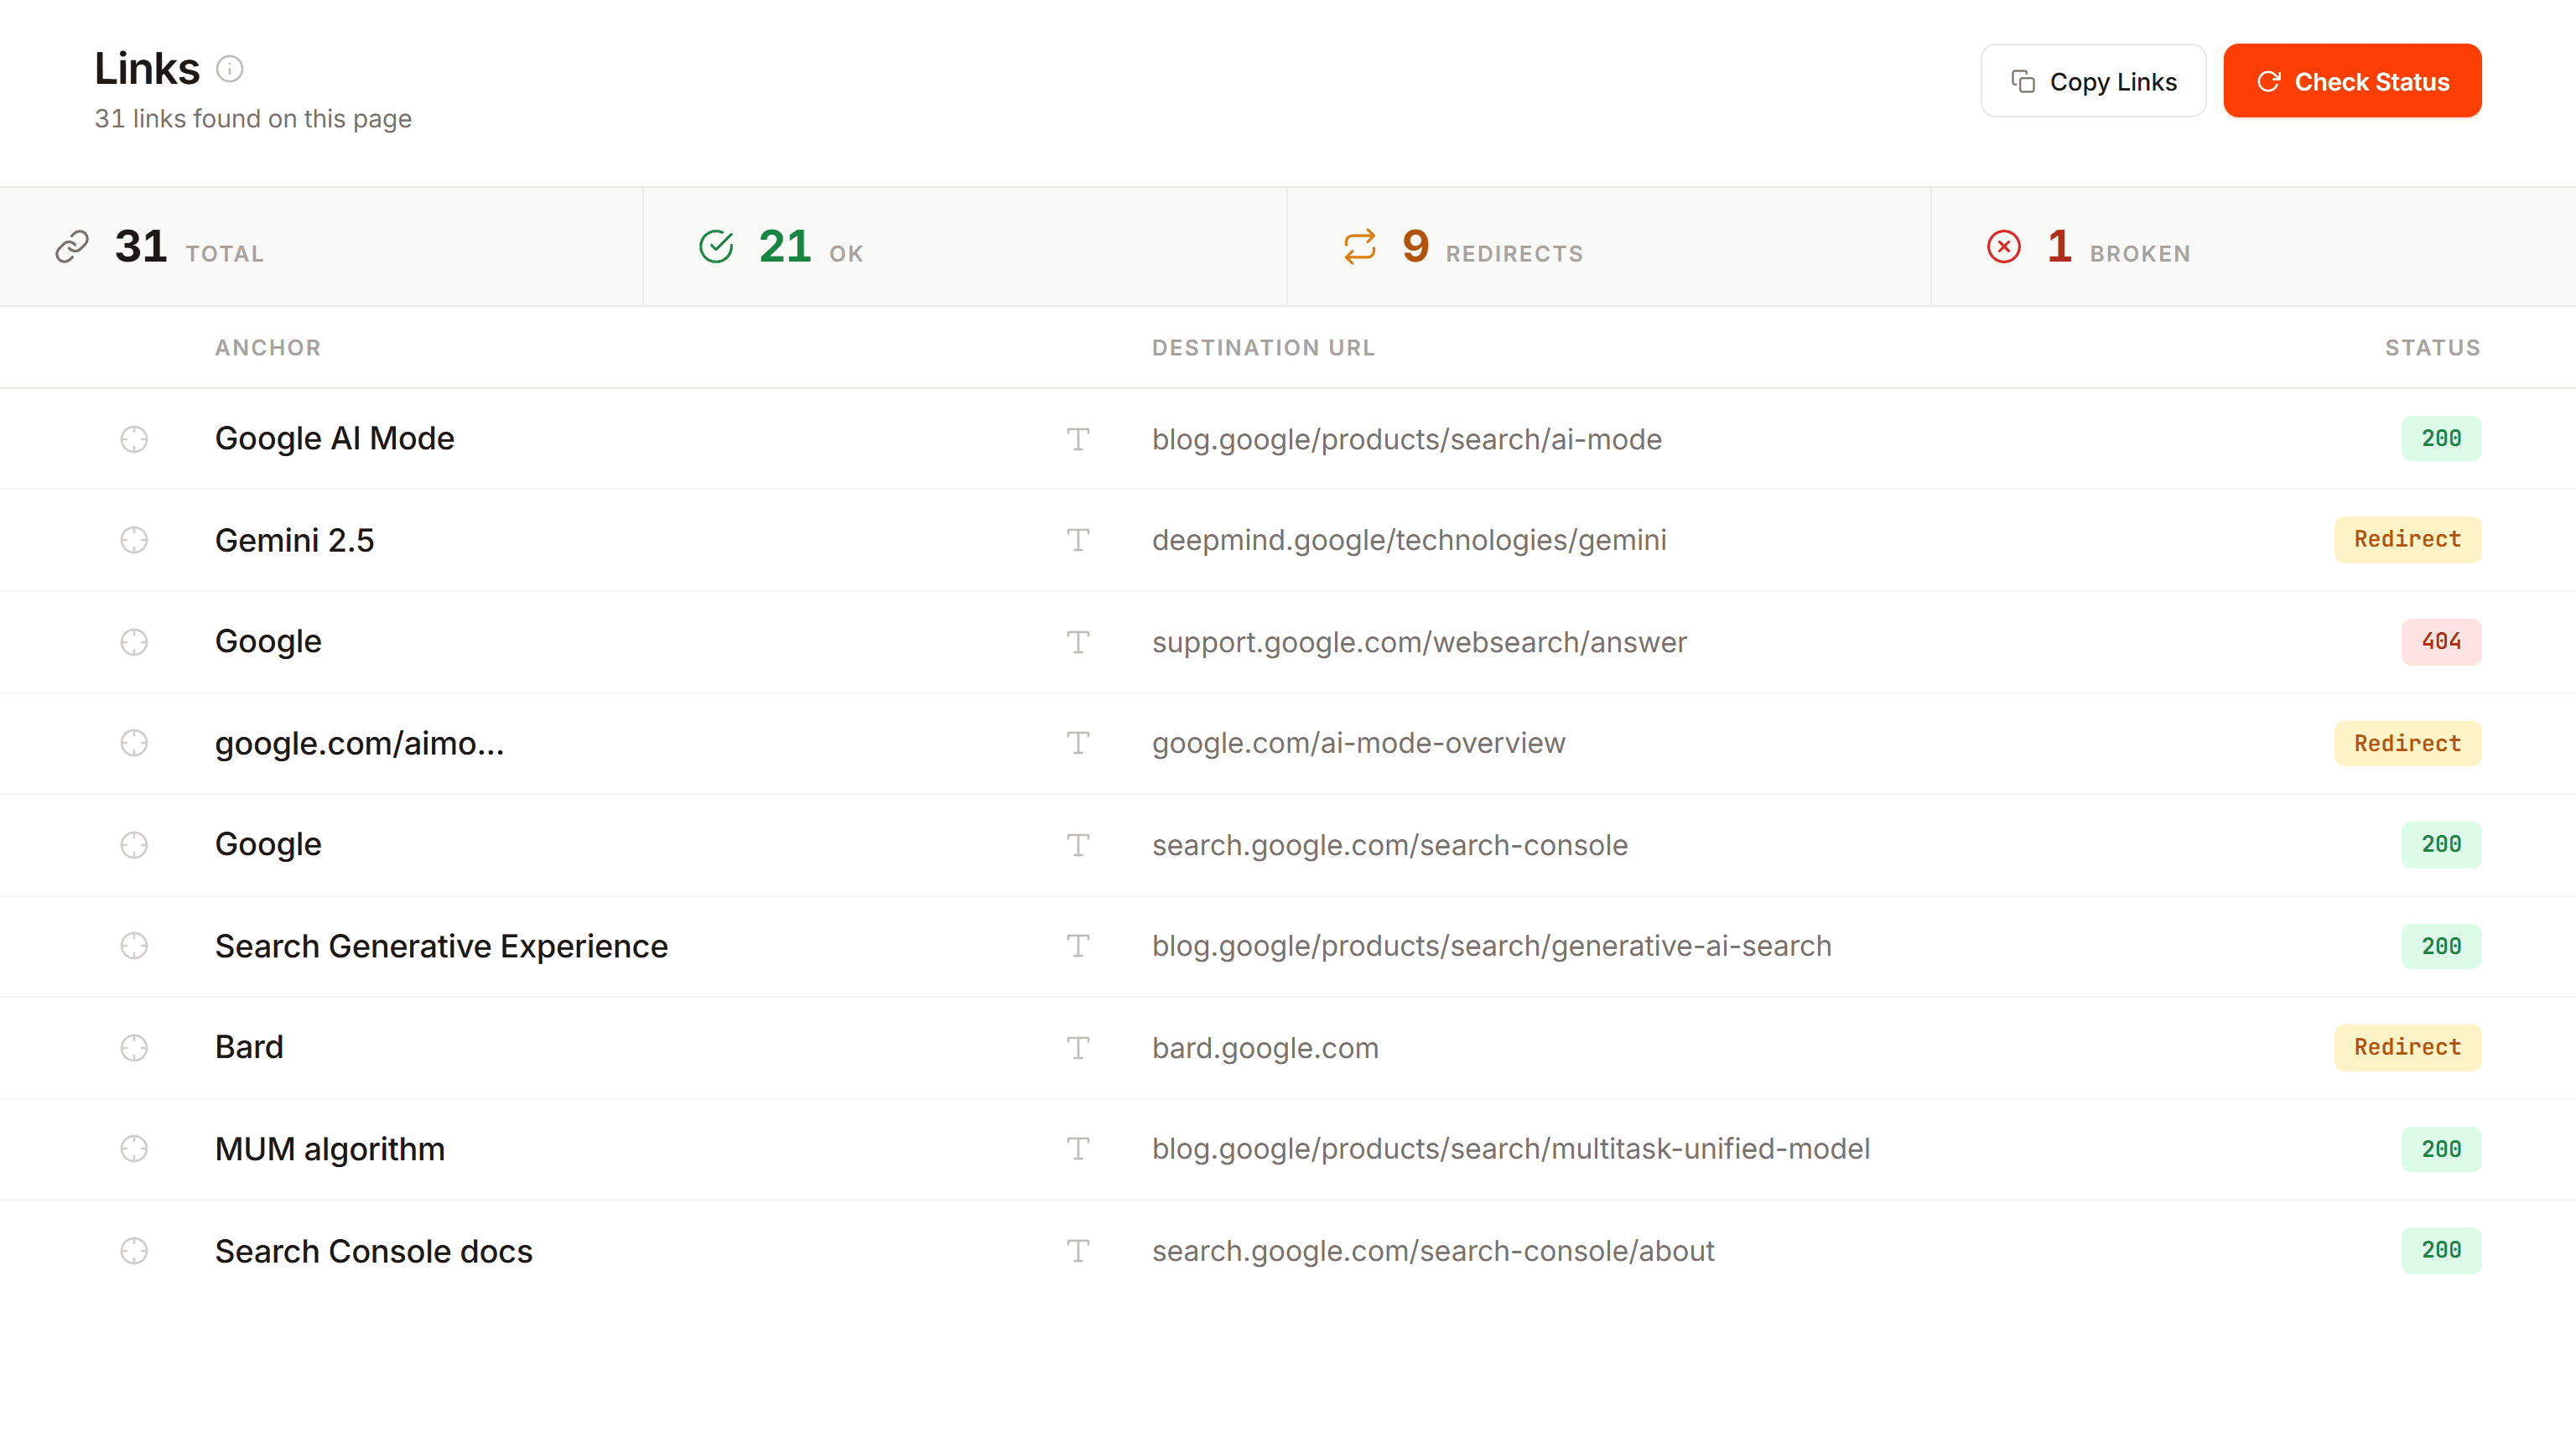
The Links tab inventories every editorial link in the content area — not navigation, not footer links, not template elements. Each link shows in a grid with its anchor text, a type classification (text link, image link, button, PDF, document, etc.), the destination URL, and a status column.
Status checking
Hit “Check Status” and the extension runs HEAD requests against every unique URL. Results come back as colored badges — green for healthy, amber for redirects, red for broken or unreachable — and the status bar at the top tallies the counts in real time.
One detail that matters if you do link audits regularly: the status check captures the initial response, not the final destination after following redirects. A 301 shows as a redirect even if it ultimately resolves to a healthy page. This is what you want — redirect chains add latency, they signal neglected content architecture, and from a crawl efficiency standpoint you’d rather have clean links than chains for Googlebot to resolve. The tab surfaces these so you can update them to point directly to the current URL and eliminate redirect hops.
Full-site crawlers of course catch these things too, but not when you’re on a single page mid-workflow and want a quick read on links.
Locate on page
Every row has a crosshair button that scrolls the actual webpage to that link and highlights it with a brief pulsing animation. Useful for finding a broken link in context — the editorial surroundings often determine how urgent the fix is and what the right replacement might be.
Tooltips throughout the grid show full anchor text and full URLs on hover, since both frequently get truncated in the columns.
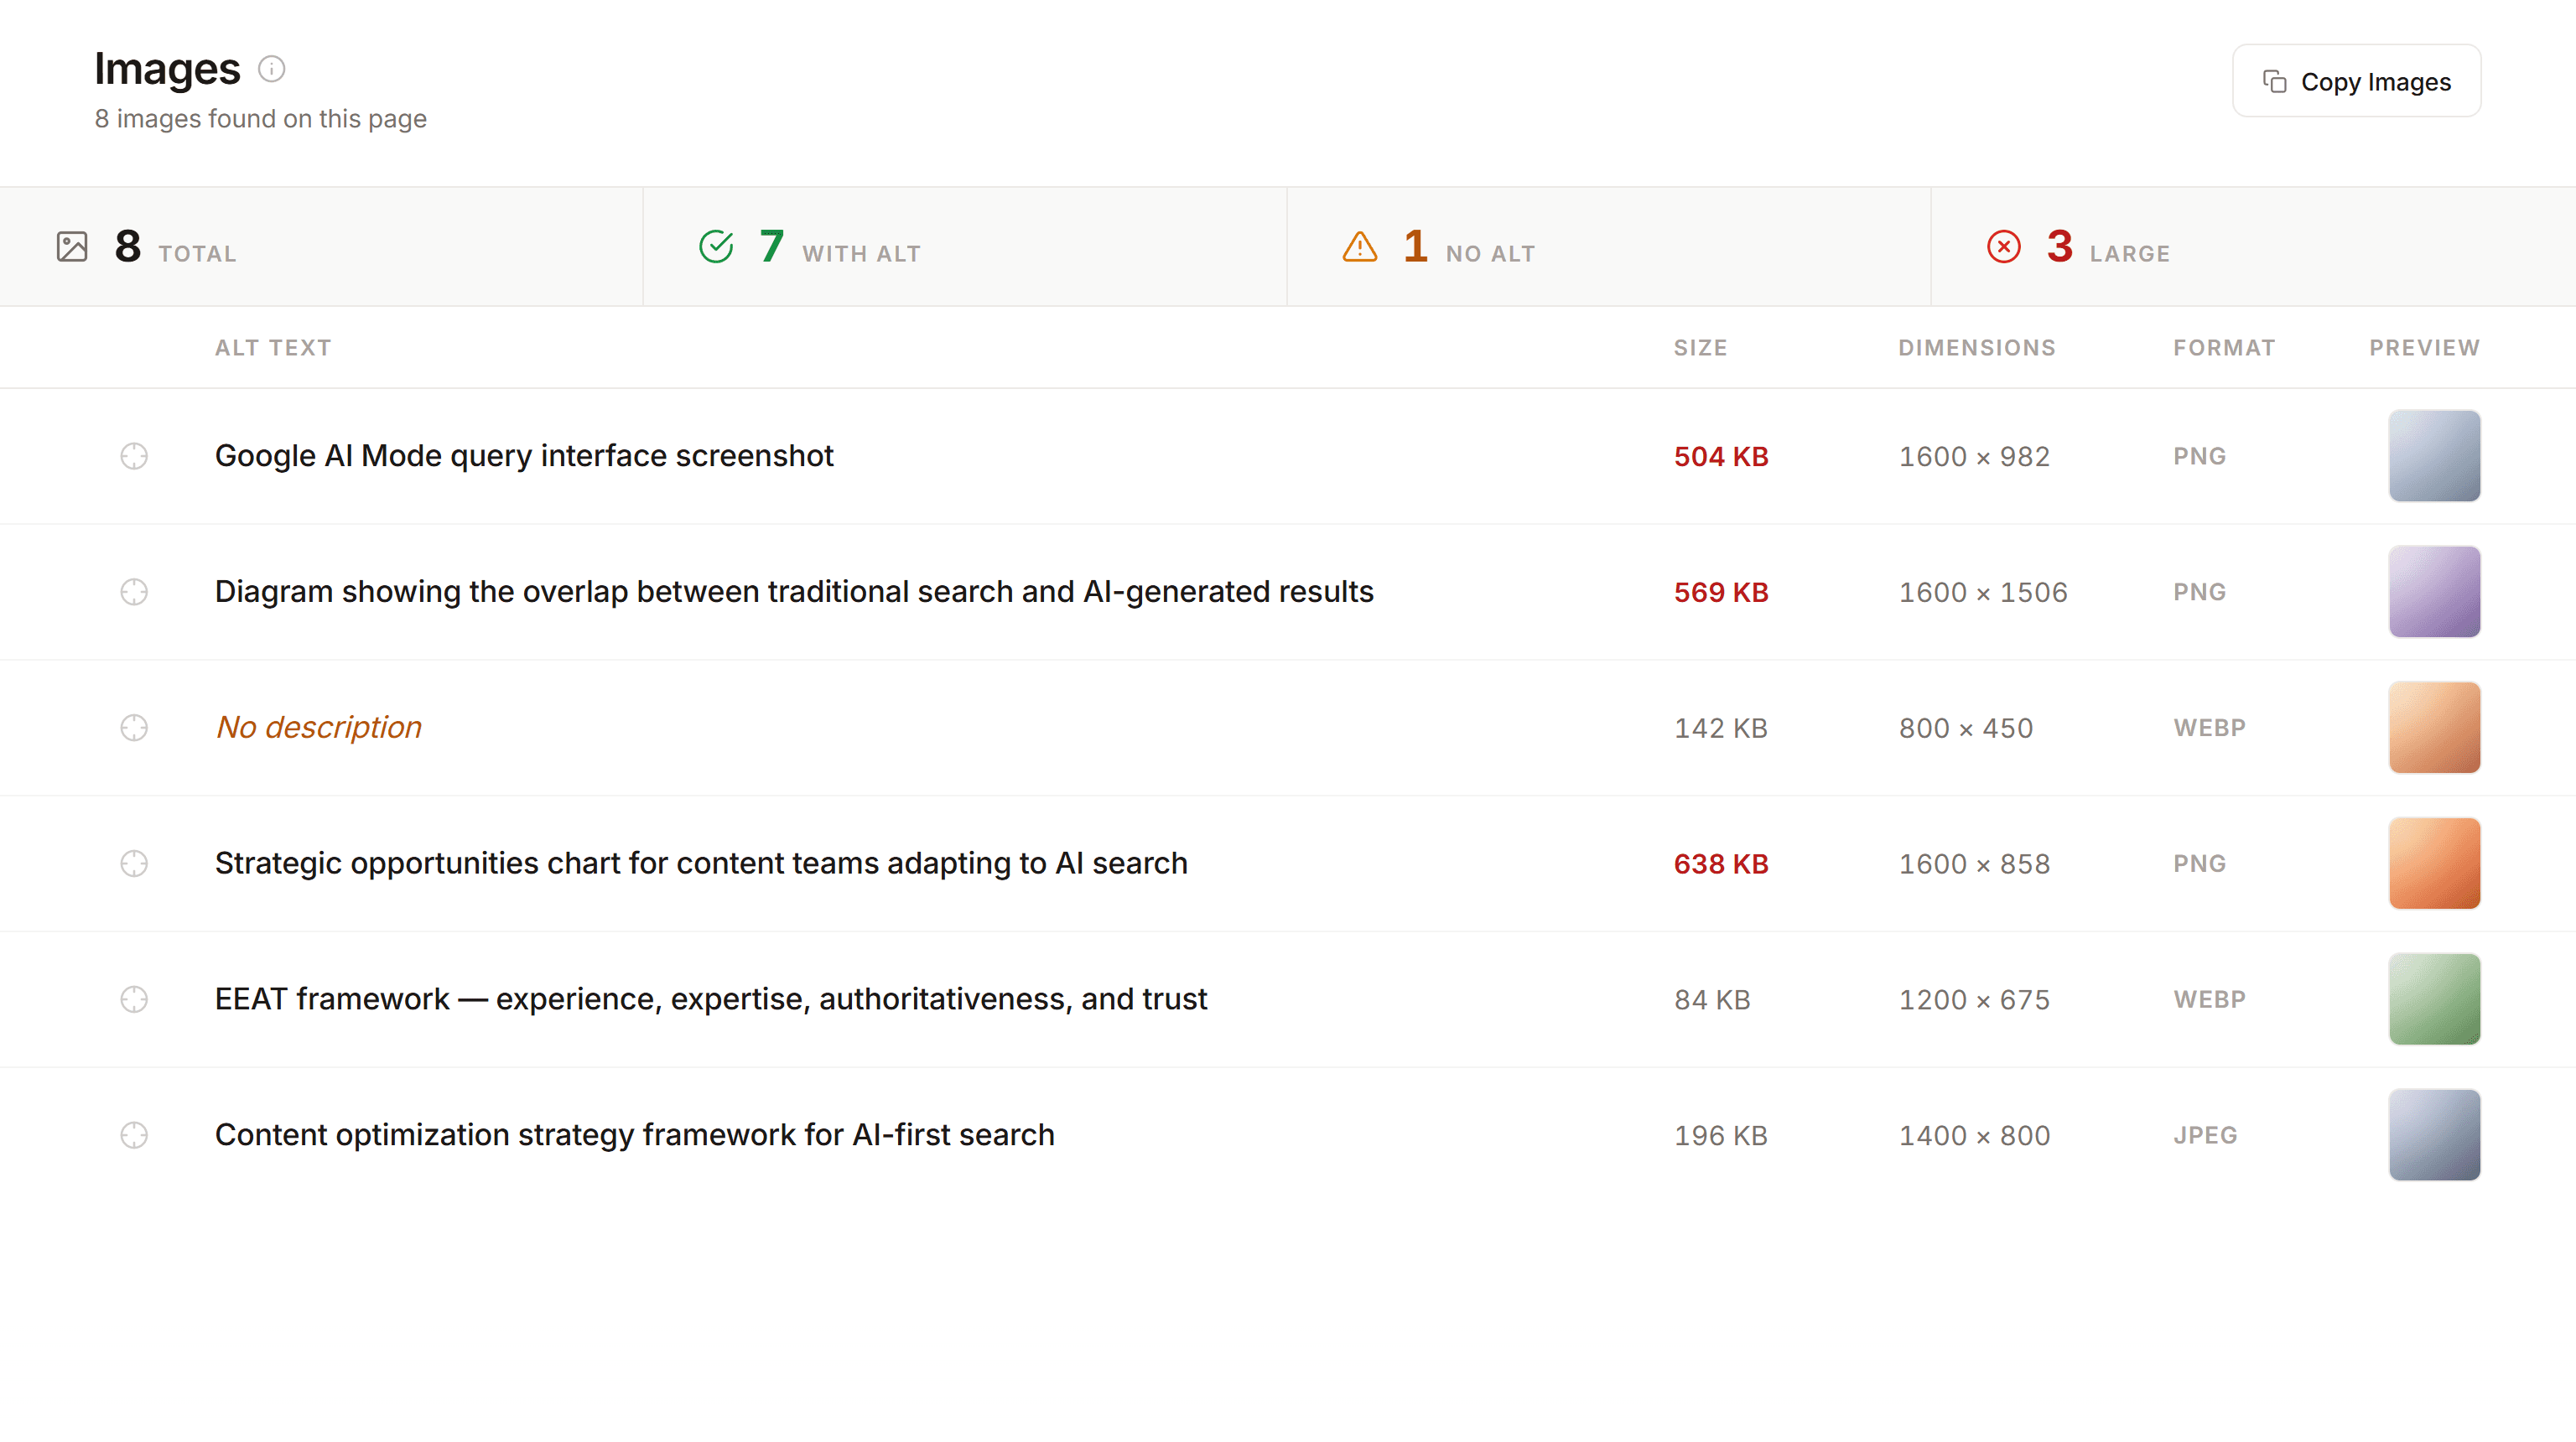
Audit every image on the page
The Images tab follows the same approach — a grid of every content image with the metadata that matters for SEO and performance. Each row shows the alt text, file size, dimensions, format, and a thumbnail preview you can click to open the full image. Same locate-on-page crosshair button as the Links tab.
Alt text at a glance
The status bar immediately tells you how many images have alt text and how many don’t. In the grid, missing alt text is flagged in amber italic — easy to spot while scanning. The extension checks multiple sources beyond just the alt attribute (aria-label, title, figcaption, parent link text) before flagging something as missing, so the count is accurate.
File size and format
Files over 500KB display in red. Combined with the format and dimensions columns, you can quickly spot optimization opportunities — a 2 MB JPEG at 4000×3000 that could be a fraction of that size in WebP at display dimensions.
Thumbnails on the right let you visually confirm what each image is — particularly useful when you find a missing alt text entry and need to see what the image actually shows before writing a description.
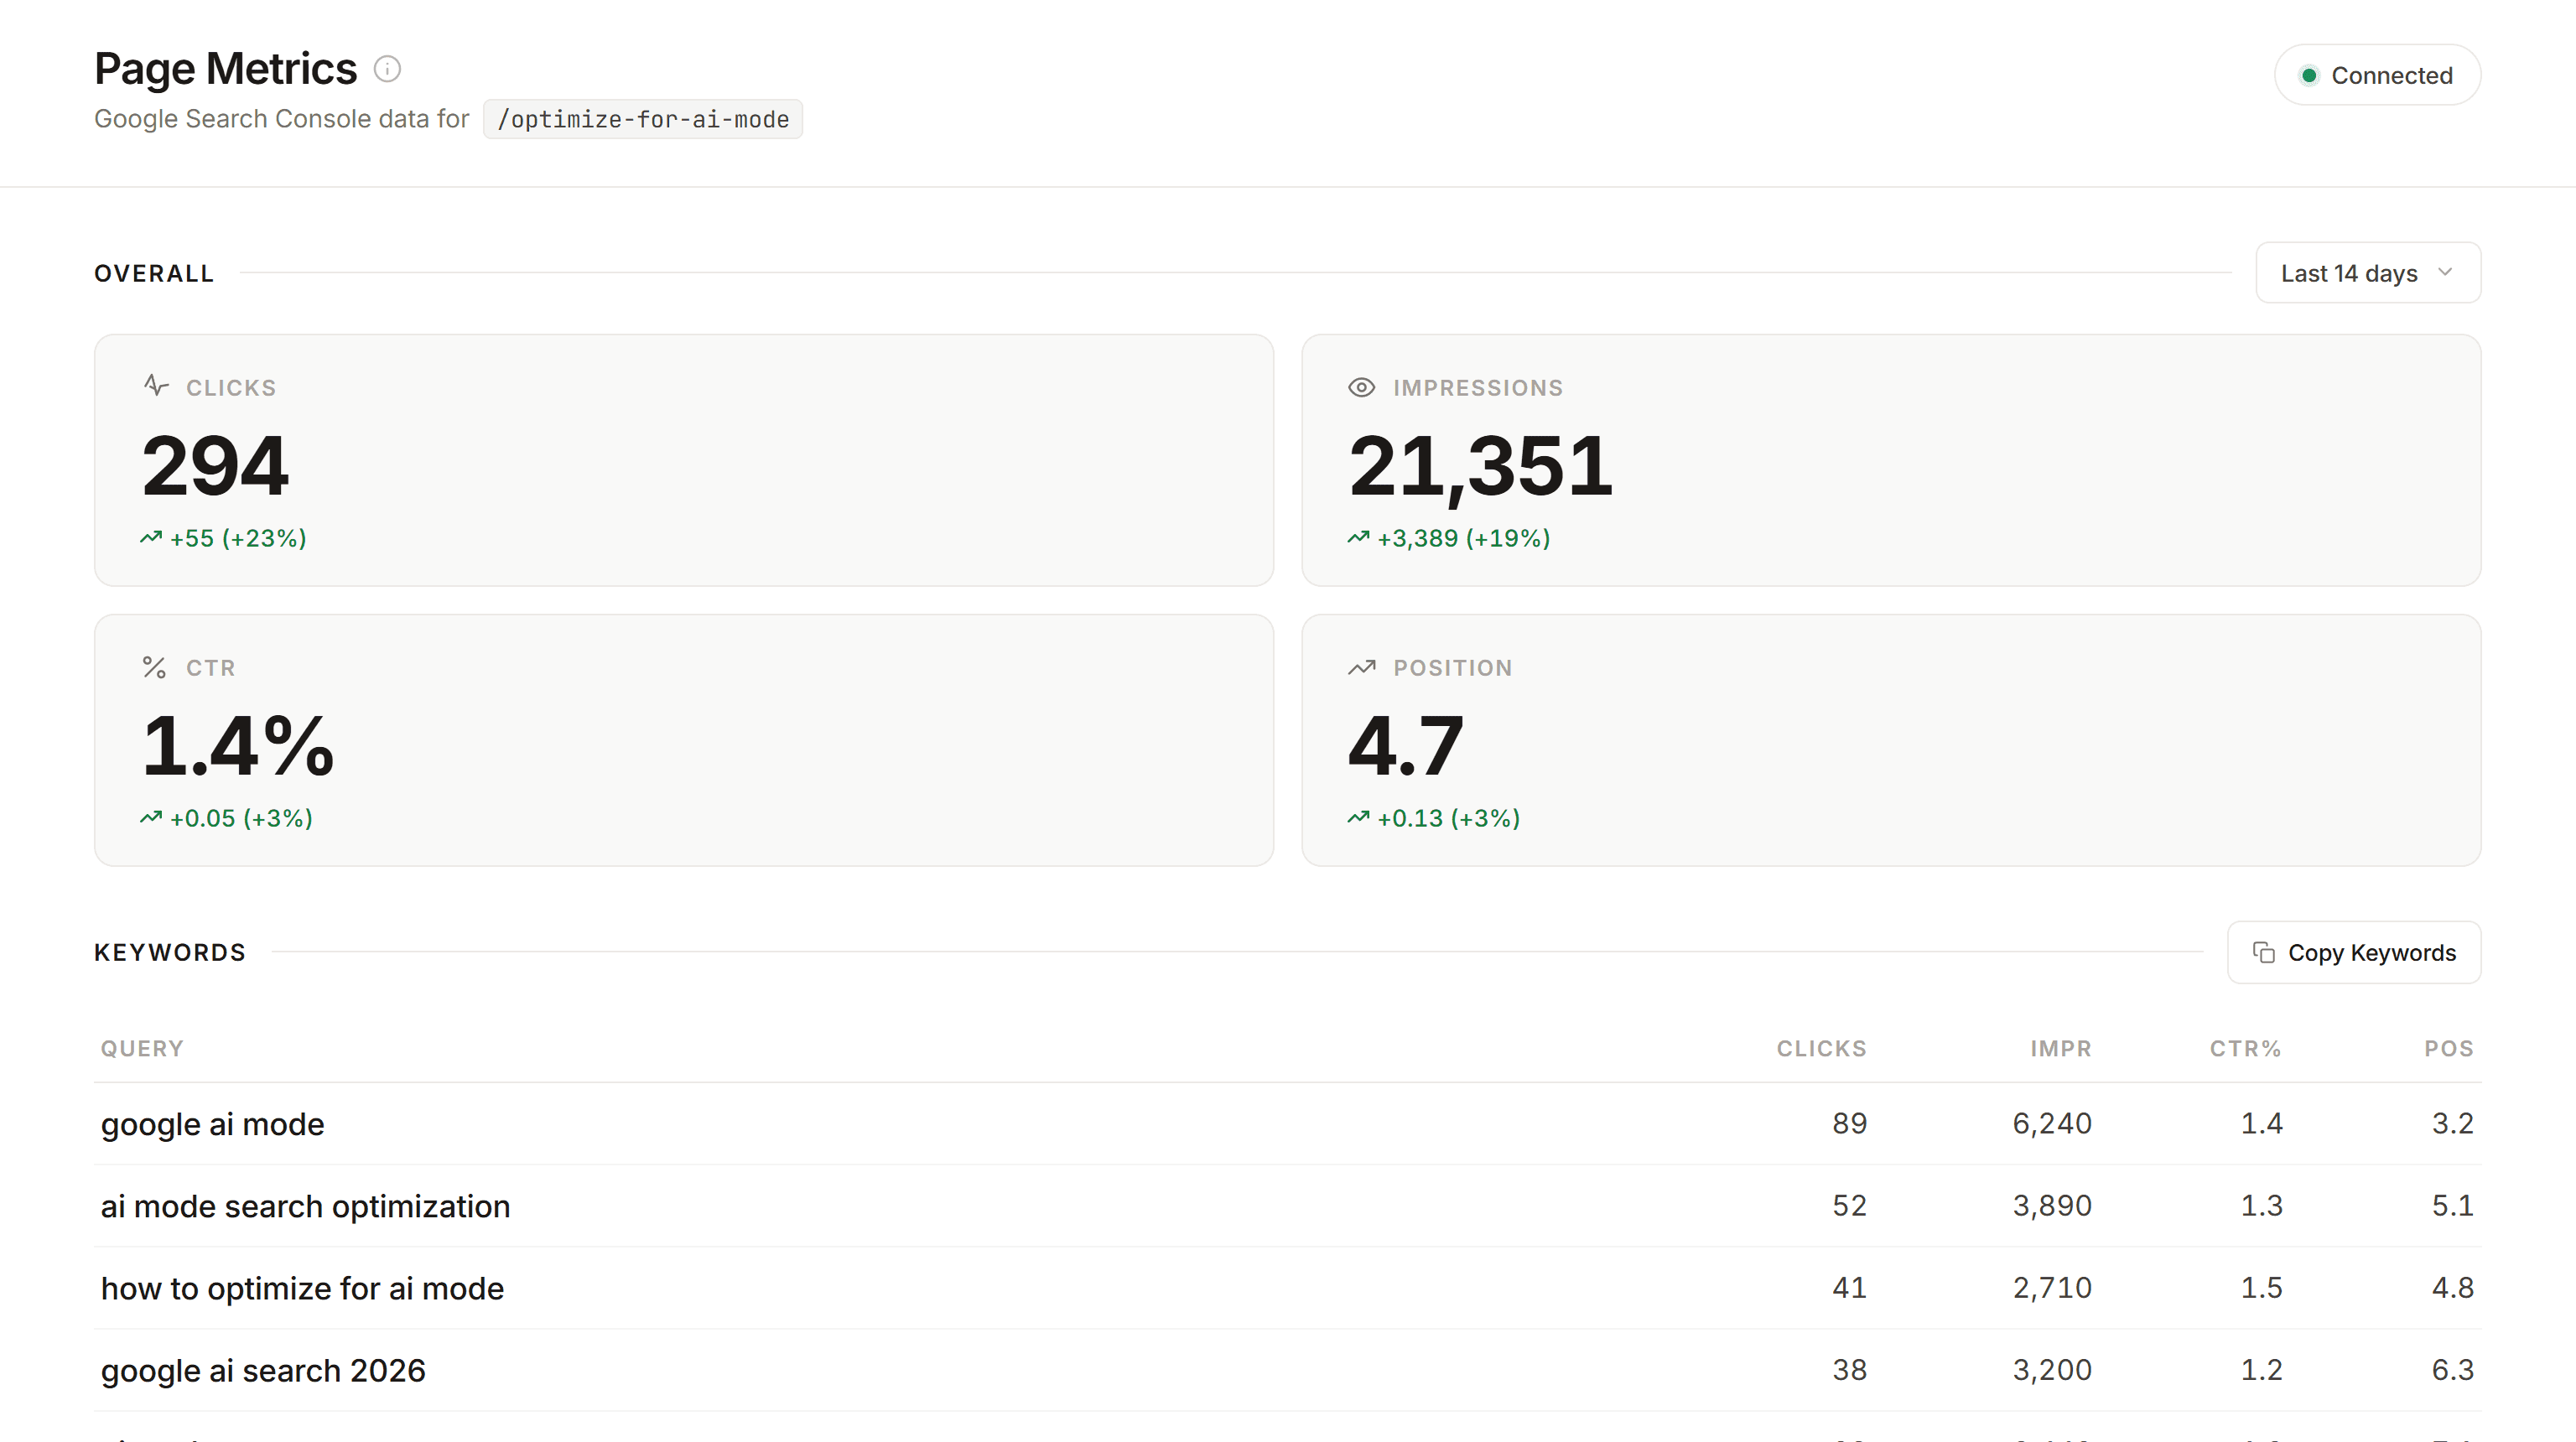
Check the actual search performance
The Metrics tab connects to your Google Search Console account and shows organic performance for the specific URL you’re viewing — clicks, impressions, CTR, and average position over the last 7, 14, or 28 days, each with a comparison against the prior period.
Below the metric cards, a Keywords section shows the top queries driving impressions to this page, with individual clicks, impressions, CTR, and position for each. A “Copy Keywords” button exports them as tab-separated values that paste cleanly into a spreadsheet.
Connecting
One-time setup: click “Connect Google Search Console,” authorize through Google’s standard OAuth flow, and the connection persists across sessions. The extension requests read-only access — it can view your data but can’t modify anything — and all data stays local to your browser. Disconnect anytime from the account dropdown.
If you navigate to a site that isn’t in your Search Console properties, the tab tells you clearly and lists the properties you do have connected. No confusing error states.
Content analysis meets search data
The real value is having performance data right next to everything else.
You notice a page has strong impressions but low CTR. Switch to the Outline tab and the title is 72 characters — red badge, definitely getting truncated. Copy the title, copy the keywords from Metrics, and you have everything you need to write a better one in under a minute.
Or you see position and clicks declining. Switch to Full Content, export the Markdown, paste it into an AI tool alongside the keyword list and the performance trend. The AI now has structured content and real data to work with — the suggestions it gives back are dramatically more actionable.
That cycle — performance data informing content decisions, content analysis grounded in search data — is what the five tabs are designed to support together.
Put it all together
Each tab is useful on its own, but they’re designed to work as a system. The most common power-user workflow brings them all together:
Start with Metrics. What keywords is this page ranking for? How are clicks and position trending? Is there a CTR problem or a ranking problem? This sets the direction for everything else.
Check the Outline. Is the title getting truncated? Is the description compelling for the keywords people are actually searching? Is the heading hierarchy clean? How old is this content?
Scan Links and Images. Any broken links dragging things down? Any redirect chains worth cleaning up? Missing alt text? Oversized images hurting load time?
Extract the content. Switch to Full Content, toggle to Markdown, copy. You now have structured content ready for AI-assisted analysis.
Feed it all to your AI tool of choice. The Markdown gives the AI structure. The keyword list and performance data give it context. The result is specific, actionable suggestions tied to real search behavior — not generic “add more keywords” advice.
The whole thing takes a few minutes per page. For content refresh planning, competitive analysis, pre-publish checks, or building audit spreadsheets — it’s the same five tabs, the same workflow, adapted to whatever the page needs.
A few things worth knowing
The extension only runs when you click the icon. No background activity, no browsing monitoring, no automatic analysis.
Everything is local. Content extraction, metadata parsing, image analysis — all happens in your browser. The only network requests are HEAD requests for link status checking and Google API calls for Search Console data.
Dark mode is available from the toggle in the sidebar footer. Preference persists across sessions.
No account needed for 4 of 5 tabs. Full Content, Outline, Links, and Images work immediately on any page. Only Metrics requires a Search Console connection.
Get Page Signals
Page Signals is free. No account required, no premium tier, no usage limits.
→ Add to Chrome (Chrome Web Store)
→ Learn more (feature overview and screenshots)
If you have feedback or run into anything unexpected, I’d love to hear about it — feel free to drop me a note here.
I built this for my own workflow first. Hopefully it’s useful for yours too.
Let's build something that compounds.
Consulting engagement, product feedback, a thoughtful question, or just hello. I reply to everything I read.